
Chapter 1: Introduction
|
1-7: The Display | |
The Electric display varies from platform to platform. The image below shows a typical display with some essential features.
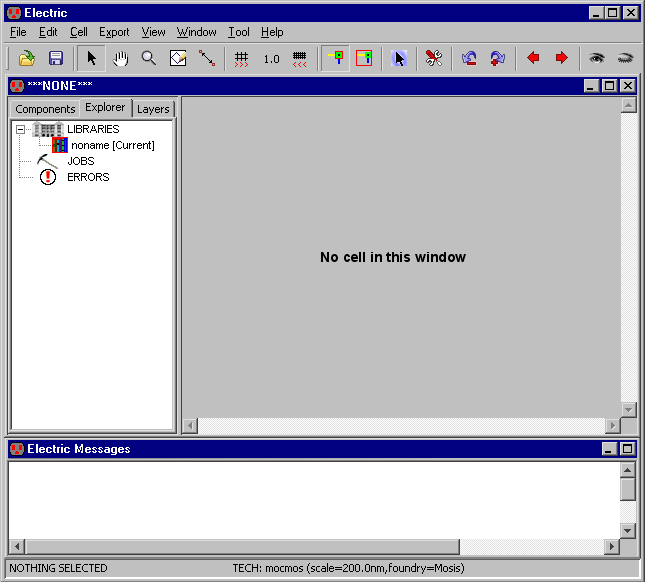
The editing window is the largest window that initially says "No cell in this window" (this indicates that no circuit is being displayed in that window). You can create multiple editing windows to see different parts of the design.
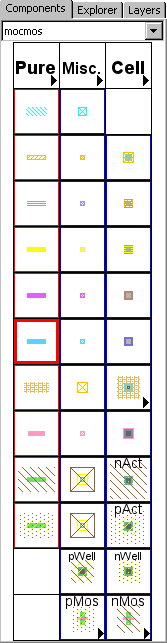 |
The left side of the edit window is the side bar that has 3 tabbed sections, the components menu, the cell explorer, and the layers. You can move it to the right side with the On Right command (of menu Windows / Side Bar) and move it back with the On Left command. You can also request that the side bar always be on the right by checking "Side bar defaults to the right side" in the Display Control Preferences (in menu File / Preferences..., "Display" section, "Display Control" tab). The cell explorer lets you examine the hierarchy, system activity, and error messages (see Section 4-5-2 for more). The components menu shows a list of nodes (blue border) and arcs (red border) that can be used in design. The arrangement of the entries in the components menu varies with the different technologies. For MOS technologies, see Section 7-4-2; for schematics, see Section 7-5-1; and for artwork, see Section 7-6-1. The top three entries in the components menu let you place pure-layer nodes (see Section 6-10-1), miscellaneous objects (see Section 7-6-3) and instances of cells (see Section 3-3). The layers tab lets you control which parts of the display are visible. See Section 4-5-3 for more on layer visibility. |
Below the edit window is the messages window, which is used for all textual communication.
Above the edit windows is a pulldown menu along the top with command options. On some operating systems, the pulldown menu is part of the edit window, and on others it is separate. Below the pulldown menu is a tool bar which has buttons for common functions.
Finally, the status area gives useful information about the design state. It appears along the bottom of the editing window or (in this example) at the bottom of the screen. The status area shows cursor coordinates, and can show global coordinates when traversing the hierarchy (see Section 4-3).
 |
Previous |  |
Table of Contents | Next |  |